Telemetry is the process of collecting usage, performance, and process-level information from the application into some data store, which then can be used by application developers or system administrators to improve, diagnose or support the application.
Microsoft defines Application Insights, a feature of Azure Monitor, as an “extensible Application Performance Management (APM) service for developers and DevOps professionals.” Use it to monitor your live applications. It will automatically detect performance anomalies and includes powerful analytics tools to help you diagnose issues and understand what users actually do with your app. It’s designed to help you continuously improve performance and usability”, so in other words, Application Insights is Microsoft’s technology to provide telemetry and instrumentation services for Applications. Various SDKs and packages are available that allow developers to connect to Application Insights Service from their application and pass the instrumentation data. More on Application Insights can be found here.
What do Application Insights have to do with Power Platform?
Power Platform allows pro and citizen developers to build simple and sophisticated applications for all kinds of devices and browser types. As a developer fulfilling business requirements and designing it accordingly, having enough insights into how this application is being used is also very handy in evolving and improving the apps. Realizing this, Microsoft has provided native integration with Application Insights and made it very easy for developers to set it up.
This post will cover how to set application insights and connect them to Canvas Apps, Model-Driven Apps, and Portals and what information we can extract from this.
Setting up Application Insights
Log on to https://portal.azure.com using the Administrator account.
Create a new resource.

.
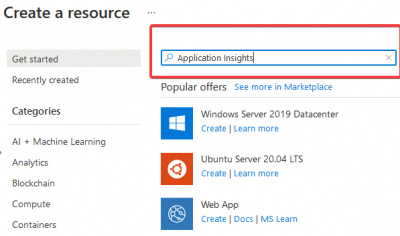
Find Application Insights in the search bar.
.
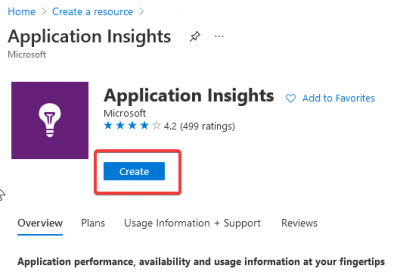
Click Create.
.
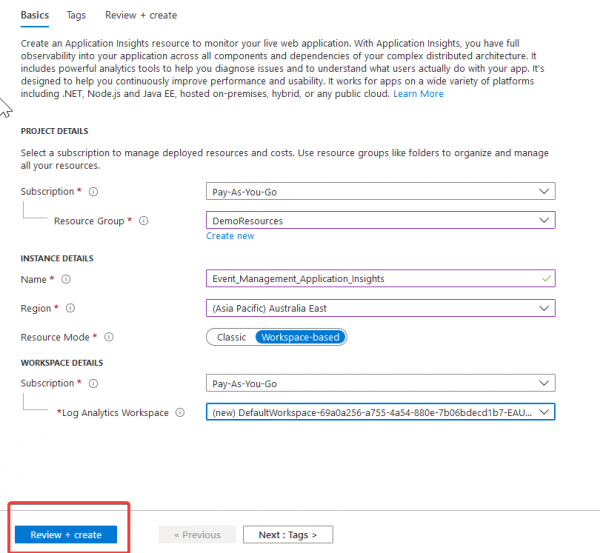
Provide the parameters and click Review + Create.
.
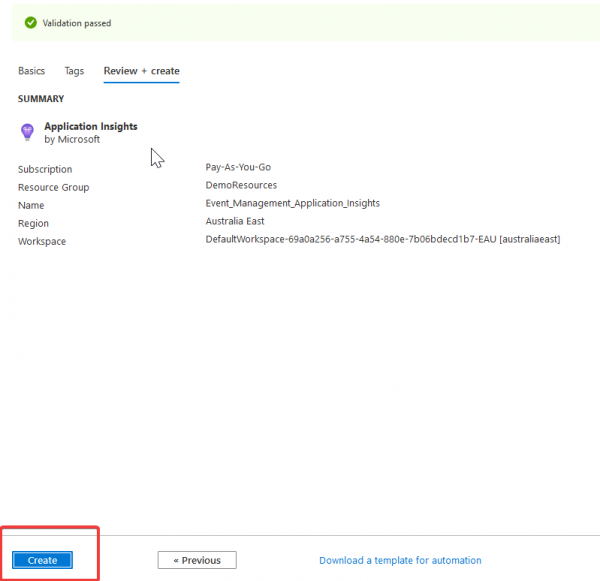
Click Create if everything looks OK on the review page.
.
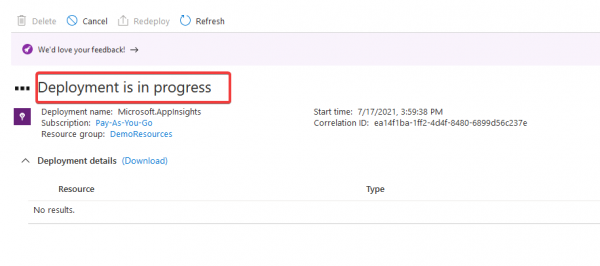
This will start the Application Insights deployment process.
.
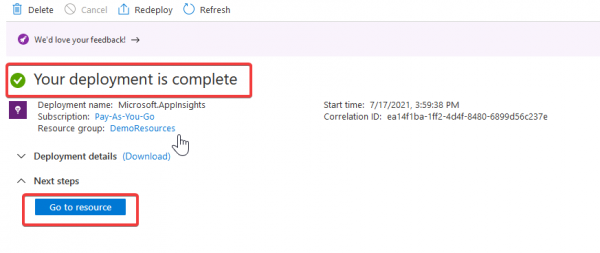
Once done, click Go to Resource to navigate to the Application Insights Overview.
.
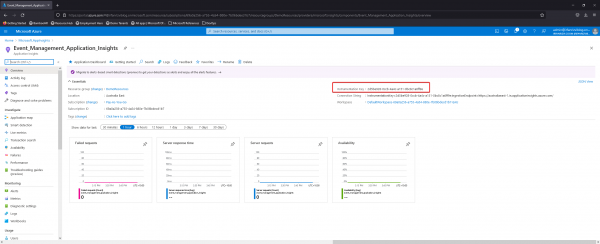
Copy the Instrumentation Key for later steps.
.
Connecting Canvas Apps to Application Insights
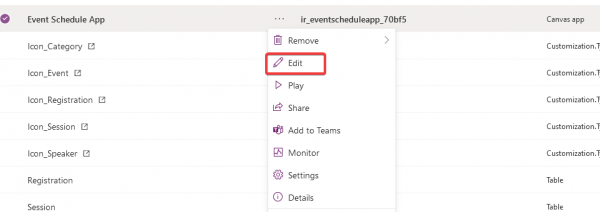
Edit your Canvas App and open it in Creator Portal.
.
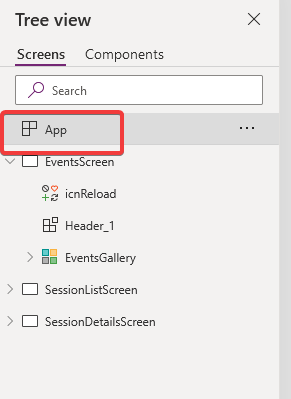
Once the app is open for editing, Click on the App icon in the left-hand navigation (Tree View).
.
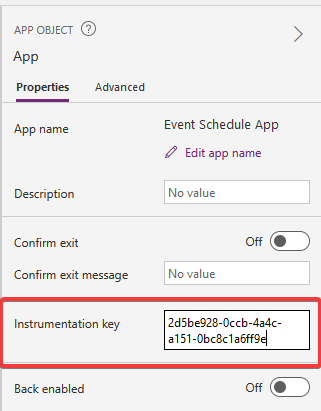
Paste the Instrumentation Key copied from Application Insights Overview Page in the Instrumentation Key field.
.
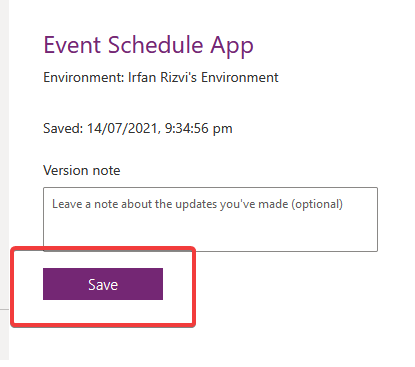
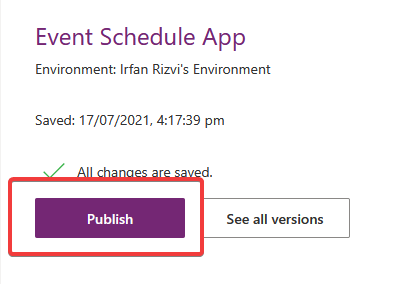
Save & Publish the App.
Connecting PowerApps Portal to Application Insights
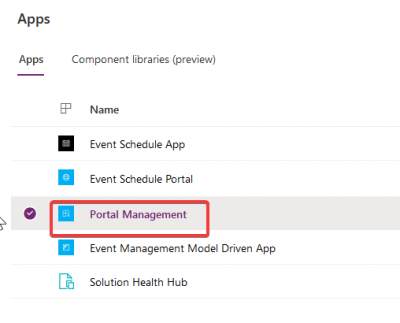
Open the Portal Management Model Driven App.
.
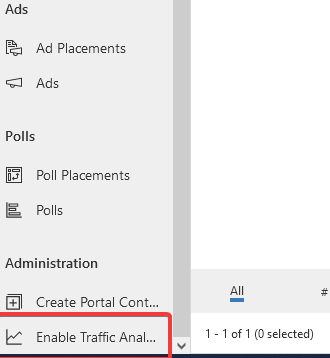
Navigate to Enable Traffic Analytics link in the side navigation.
.
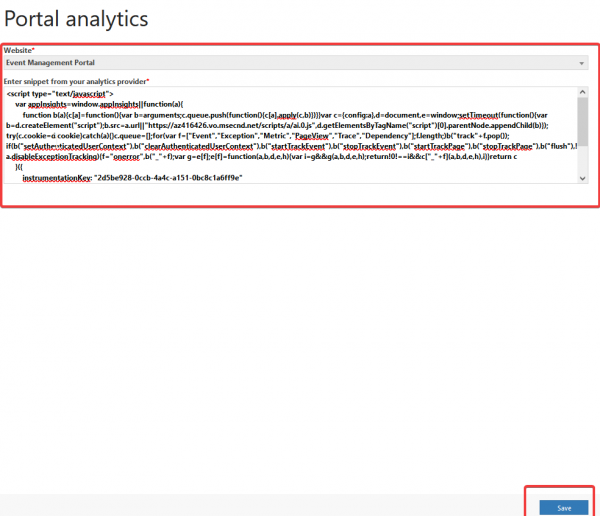
Select the Portal in Website field, and copy the below script in the snippet section, make sure you replace the Instrumentation Key with your key and click Save.
Connecting Model-Driven Apps to Application Insights
This feature is currently in public preview and the general availability has not been disclosed yet.
1. Log on to Power Platform Admin Center at https://admin.powerplatform.microsoft.com using Global Admin or Power Platform Admin account.
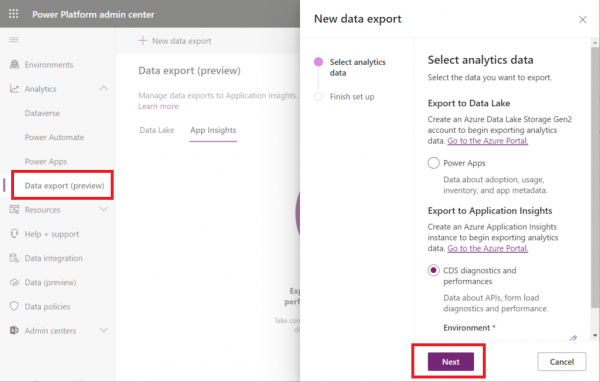
2. Click on Data Export (preview) on side navigation and navigate to App Insights Tab.
3. Click on New Data Export button in the toolbar.
4. Select CDS diagnostics and performance under Export to Application Insights.
5. Select the environment and click Next.
What can we use this Telemetry Data for?
Well, this warrants a blog post in itself, but I’ll give you a quick summary of the various kind of information Application Insight is collecting from Power Apps. This includes:
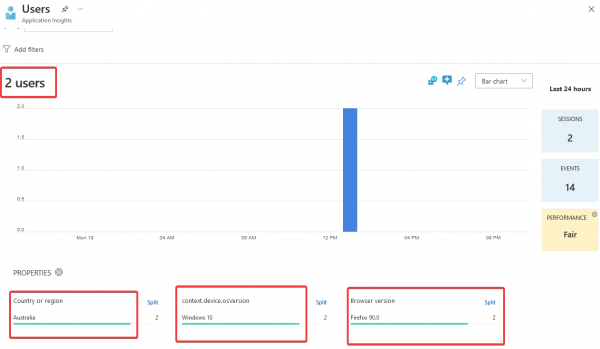
User Details and their breakdown by Location, OS, and Browsers allows you to pick up certain behaviours based on these breakdowns; it also assesses the application performance in terms of load time.
.
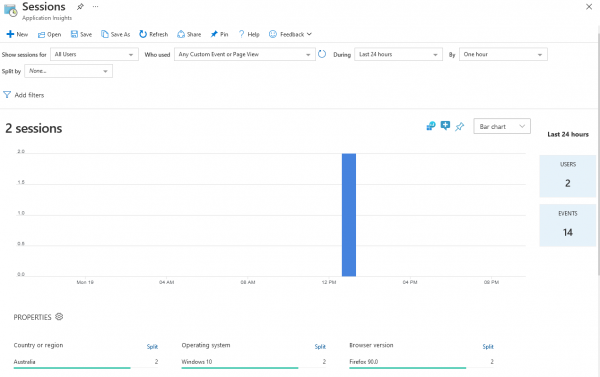
Session Details, a user can have multiple sessions on an app, so each session data is also recorded.
.
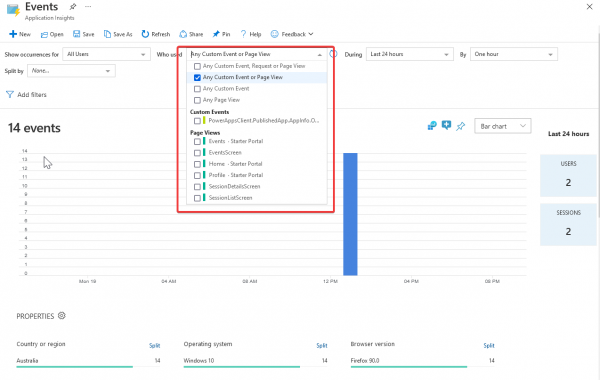
Event Details, events are certain trigger points that happen inside the app, it can be system-generated like when a screen is loaded or a custom event that can be captured by the developer using Tracing.
.
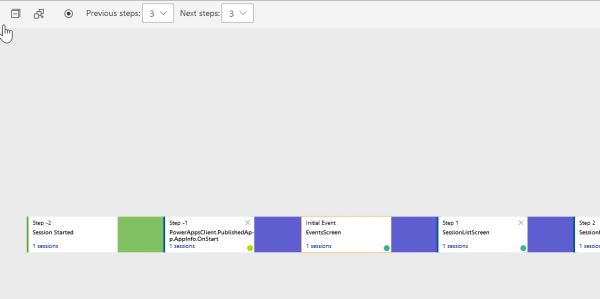
User Flows captures a general flow of applications based on a certain starting point.
Conclusion
So folks, this was a quick summary of what Application Insights is, how you can connect to it in Power Apps and what kind of useful information you can get out of it. Follow us on LinkedIn to get more updates on Microsoft Power Platform and Dynamics 365. You can also subscribe to my personal blog for tips and technical updates.
About the Author: Irfan Rizvi
Irfan is an experienced Microsoft certified Technology Consultant and Solutions Architect. He has more than 20 years of industry experience and has worked with a variety of Microsoft solutions. His current focus is on the Microsoft Power Platform, and loves to keep himself updated with the tech industry.

